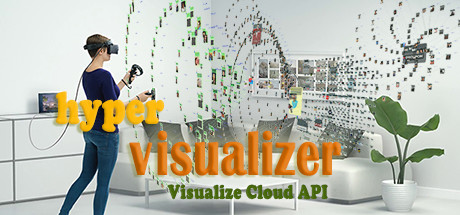
A data visualization platform that allows you to load data into graphs and navigate your graph to find new insight.
Alle Rezensionen:
9 Nutzerrezensionen - Es werden mehr Nutzerrezensionen benötigt, um eine Gesamtbewertung berechnen zu können.
Veröffentlichung:
19. Jan. 2019
Entwickler:
Publisher:
Tags

Melden Sie sich an, um dieses Produkt zu Ihrer Wunschliste hinzuzufügen, zu abonnieren oder als „Ignoriert“ zu markieren.

Early Access-Software

Bringen Sie sich in die Entwicklung ein.

Hinweis: Diese Early Access-Software ist noch nicht fertig und könnte sich in Zukunft verändern. Wenn Ihnen die Software im aktuellen Zustand nicht gefällt, sollten Sie abwarten und sehen, ob sich die Software weiterentwickelt. Mehr erfahren

Was die Entwickler zu sagen haben:

Wozu Early Access?

„This is a data visualization platform and like any other data analysis software there is much that needs to be done, we are doing something unique in virtual reality and we are learning along the way.
We are releasing early because we want you feedback and guidance. We want to see how this software can change the way you think about information in your mind and we want to help you to leverage this app to think better and make more informed decisions.
Please use this app and let us know what you think.“

Wie lange wird diese Software ungefähr den Early Access-Status haben?

„There is a lot we like to do with this app, many interesting and useful features are going to be added in the coming months, we are expecting this alpha testing phase to take probably up to a year or even more. But nonetheless it might be very useful for some users, feel free to leave comments and reviews and tell us how do you like to see this app evolve.“

Wie soll sich die Vollversion von der Early Access-Version unterscheiden?

„Currently the app is connected to one limited database of startup profiles, but this app is aimed to be a platform to connect to any API and visualize it's data.
We are planning to connect to many prominent APIs such as Amazon, Facebook, Linked-in and Imdb.
You could load pre-made graphs from these sources and run various queries such as detailed data analysis, data querying, sorting, grouping and many more. You will have the ability to login to your dashboard and upload your own data and create custom graphs, you can also share and collaborate in sessions with your friends and colleagues.“

Was ist der derzeitige Stand der Early Access-Version?

„In this early release of the app we have provided a list of four graphs for most funded startups and their prominent investors and employees. There is the ability to browse these graphs and dig into details of each as you wish. You can save your session and resume from where you left.
Your comments and suggestions and market demand will tell us what features to add first and how to implement them.
Please keep the suggestions coming.“

Wird diese Software während und nach Early Access unterschiedlich viel kosten?

„Early access will always be free, but we aim to keep the final version free as much as we can.“

Wie werden Sie versuchen die Community in den Entwicklungsprozess miteinzubeziehen?

„There is a survey in our website at http://hypervisualize.it/survey.html
We will read and take your answers seriously. Please make sure you fill out the survey after you try the app.
We are also actively seeking your advice and answer your questions on Steam community page.“
Weiterlesen
Nur VR

Hyper Visualizer verwenden

Kostenlos
 
Alle Diskussionen anzeigen

In den Diskussionsforen können Sie Fehler melden und Feedback zur Software abgeben

Über diese Software

A data visualization platform that allows you to load data into graphs and navigate your graph to find new insight.
We have prepared a collection of popular graphs and set them for easy access, visualization and exploration so you can get into what matters to you and understand data in deeper levels.
We are working hard to make this app a handy tool for fellow data enthusiasts who want to skip the preparation, filtering, querying and data wrangling and immerse into data in a more meaningful way using the power of virtual reality.
This version of the app allows you to visualize CrunchBase, a database for startups, their investors, funding rounds, employees and their relationships.
We are in early development phase of this project and your feedback is highly appreciated, please leave reviews and tell us what you think after using this app.

Systemanforderungen

    Mindestanforderungen:
    • Betriebssystem *: Windows 7, Server 2013
    • Prozessor: Intel Core i5
    • Arbeitsspeicher: 4 GB RAM
    • Grafik: NVIDIA GTX 970 (AMD Radeon R9 290)
    • Netzwerk: Breitband-Internetverbindung
    • Speicherplatz: 250 MB verfügbarer Speicherplatz
    • VR-Unterstützung: Oculus PC
    Empfohlen:
    • Betriebssystem: Windows 10
    • Prozessor: Intel Core i7
    • Arbeitsspeicher: 6 GB RAM
    • Grafik: NVIDIA GTX 1050
    • Netzwerk: Breitband-Internetverbindung
    • Speicherplatz: 250 MB verfügbarer Speicherplatz
* Ab dem 1. Januar 2024 unterstützt der Steam-Client nur noch Windows 10 und neuere Versionen.

Was Kuratoren sagen

Ein Kurator hat eine Rezension zu diesem Produkt verfasst. Klicken Sie hier, um es einzusehen.

Nutzerrezensionen

Art der Rezension


Erwerbsart


Sprache


Zeitraum
Zum Anzeigen von Rezensionen in einem bestimmten Zeitraum, markieren Sie diesen bitte in einem der obigen Graphen oder klicken Sie auf einen einzelnen Balken.

Graph anzeigen


Spielzeit
Filtern Sie Rezensionen nach der Spielzeit des Spielers zum Zeitpunkt der Rezension:


Kein Minimum bis Kein Maximum
Anzeigen:
Graph anzeigen
 
Graph ausblenden
 
Filter
Rezensionen ohne Themenbezug ausschließen
Spielzeit:
Es gibt keine weiteren Rezensionen, die Ihren Filterkriterien entsprechen
Passen Sie oben die Filter an, um andere Rezensionen anzuzeigen
Rezensionen werden geladen …