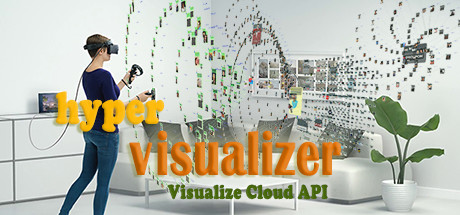
A data visualization platform that allows you to load data into graphs and navigate your graph to find new insight.
บทวิจารณ์ทั้งหมด:
9 บทวิจารณ์จากผู้ใช้ - จำเป็นต้องใช้บทวิจารณ์จากผู้ใช้จำนวนมากกว่านี้เพื่อสร้างคะแนน
วันวางจำหน่าย:
19 ม.ค. 2019
ผู้พัฒนา:
ผู้จัดจำหน่าย:
แท็ก

เข้าสู่ระบบ เพื่อเพิ่มผลิตภัณฑ์นี้ลงในสิ่งที่อยากได้ของคุณ ติดตาม หรือทำเครื่องหมายเป็นถูกละเว้น

ซอฟต์แวร์ระหว่างการพัฒนา

มีส่วนร่วมกับซอฟต์แวร์นี้ในขณะที่กำลังพัฒนา

หมายเหตุ: ซอฟต์แวร์ระหว่างการพัฒนานี้ยังไม่เสร็จสมบูรณ์ ซึ่งอาจจะมีหรืออาจจะไม่มีการเปลี่ยนแปลงเพิ่มเติมก็ได้ หากคุณไม่ตื่นเต้นกับการใช้ซอฟต์แวร์นี้ในช่วงสถานะปัจจุบัน คุณควรจะรอเพื่อตัดสินใจในกรณีที่ซอฟต์แวร์มีความคืบหน้าในการพัฒนาเพิ่มเติมมากกว่านี้ เรียนรู้เพิ่มเติม

สิ่งที่ผู้พัฒนาต้องการจะบอก:

เหตุใดจึงเป็นช่วงระหว่างการพัฒนา?

“This is a data visualization platform and like any other data analysis software there is much that needs to be done, we are doing something unique in virtual reality and we are learning along the way.
We are releasing early because we want you feedback and guidance. We want to see how this software can change the way you think about information in your mind and we want to help you to leverage this app to think better and make more informed decisions.
Please use this app and let us know what you think.”

ซอฟต์แวร์นี้จะอยู่ในช่วงระหว่างการพัฒนานานเท่าไรโดยประมาณ?

“There is a lot we like to do with this app, many interesting and useful features are going to be added in the coming months, we are expecting this alpha testing phase to take probably up to a year or even more. But nonetheless it might be very useful for some users, feel free to leave comments and reviews and tell us how do you like to see this app evolve.”

เวอร์ชันเต็มได้ถูกวางแผนไว้ให้แตกต่างจากเวอร์ชันระหว่างการพัฒนาอย่างไร?

“Currently the app is connected to one limited database of startup profiles, but this app is aimed to be a platform to connect to any API and visualize it's data.
We are planning to connect to many prominent APIs such as Amazon, Facebook, Linked-in and Imdb.
You could load pre-made graphs from these sources and run various queries such as detailed data analysis, data querying, sorting, grouping and many more. You will have the ability to login to your dashboard and upload your own data and create custom graphs, you can also share and collaborate in sessions with your friends and colleagues.”

สถานะปัจจุบันของเวอร์ชันระหว่างการพัฒนาเป็นอย่างไร?

“In this early release of the app we have provided a list of four graphs for most funded startups and their prominent investors and employees. There is the ability to browse these graphs and dig into details of each as you wish. You can save your session and resume from where you left.
Your comments and suggestions and market demand will tell us what features to add first and how to implement them.
Please keep the suggestions coming.”

ซอฟต์แวร์นี้จะมีราคาเปลี่ยนแปลงไปหรือไม่ในระหว่างและหลังจากช่วงระหว่างการพัฒนา?

“Early access will always be free, but we aim to keep the final version free as much as we can.”

คุณกำลังวางแผนให้ชุมชนมีส่วนร่วมในขั้นตอนการพัฒนาของคุณอย่างไร?

“There is a survey in our website at http://hypervisualize.it/survey.html
We will read and take your answers seriously. Please make sure you fill out the survey after you try the app.
We are also actively seeking your advice and answer your questions on Steam community page.”
อ่านเพิ่มเติม
ไม่รองรับภาษาไทย

ผลิตภัณฑ์นี้ไม่รองรับภาษาท้องถิ่นของคุณ โปรดตรวจสอบรายชื่อภาษาที่รองรับก่อนทำการสั่งซื้อ

VR เท่านั้น

ใช้ Hyper Visualizer

ฟรี
 
ดูกระดานสนทนาทั้งหมด

รายงานจุดบกพร่องและฝากข้อเสนอแนะสำหรับซอฟต์แวร์นี้บนกระดานสนทนา

เกี่ยวกับซอฟต์แวร์นี้

A data visualization platform that allows you to load data into graphs and navigate your graph to find new insight.
We have prepared a collection of popular graphs and set them for easy access, visualization and exploration so you can get into what matters to you and understand data in deeper levels.
We are working hard to make this app a handy tool for fellow data enthusiasts who want to skip the preparation, filtering, querying and data wrangling and immerse into data in a more meaningful way using the power of virtual reality.
This version of the app allows you to visualize CrunchBase, a database for startups, their investors, funding rounds, employees and their relationships.
We are in early development phase of this project and your feedback is highly appreciated, please leave reviews and tell us what you think after using this app.

ความต้องการระบบ

    ขั้นต่ำ:
    • ระบบปฏิบัติการ *: Windows 7, Server 2013
    • โปรเซสเซอร์: Intel Core i5
    • หน่วยความจำ: แรม 4 GB
    • กราฟิกส์: NVIDIA GTX 970 (AMD Radeon R9 290)
    • เครือข่าย: การเชื่อมต่ออินเทอร์เน็ตแบบบรอดแบนด์
    • พื้นที่จัดเก็บข้อมูล: พื้นที่ว่างที่พร้อมใช้งาน 250 MB
    • การรองรับ VR: Oculus PC
    แนะนำ:
    • ระบบปฏิบัติการ: Windows 10
    • โปรเซสเซอร์: Intel Core i7
    • หน่วยความจำ: แรม 6 GB
    • กราฟิกส์: NVIDIA GTX 1050
    • เครือข่าย: การเชื่อมต่ออินเทอร์เน็ตแบบบรอดแบนด์
    • พื้นที่จัดเก็บข้อมูล: พื้นที่ว่างที่พร้อมใช้งาน 250 MB
* ตั้งแต่วันที่ 1 มกราคม 2024 เวลาแปซิฟิก เป็นต้นไป ไคลเอนต์ Steam จะรองรับเฉพาะ Windows 10 และเวอร์ชันที่ใหม่กว่าเท่านั้น

สิ่งที่ผู้แนะนำกล่าว

ผู้แนะนำ 1 รายได้เขียนบทวิจารณ์ผลิตภัณฑ์นี้ คลิก ที่นี่ เพื่อดูบทวิจารณ์

บทวิจารณ์จากผู้ซื้อ

ประเภทบทวิจารณ์


ประเภทการสั่งซื้อ


ภาษา


ช่วงวันที่
ในการดูบทวิจารณ์ตามช่วงวันที่ โปรดคลิกและลากการเลือกบนกราฟด้านบน หรือคลิกบนแท่งที่กำหนด

แสดงกราฟ


เวลาเล่น
กรองบทวิจารณ์ตามเวลาเล่นของผู้ใช้เมื่อบทวิจารณ์ถูกเขียน:


ไม่มีต่ำสุด ถึง ไม่มีสูงสุด
แสดงผลเป็น:
แสดงกราฟ
 
ซ่อนกราฟ
 
ตัวกรอง
กำลังละเว้นกิจกรรมบทวิจารณ์นอกเรื่อง
เวลาเล่น:
ไม่มีบทวิจารณ์ใดเลยที่ตรงกับตัวกรองที่กำหนดไว้ด้านบน
ปรับแต่งตัวกรอกด้านบนเพื่อดูบทวิจารณ์อื่น ๆ
กำลังโหลดบทวิจารณ์...